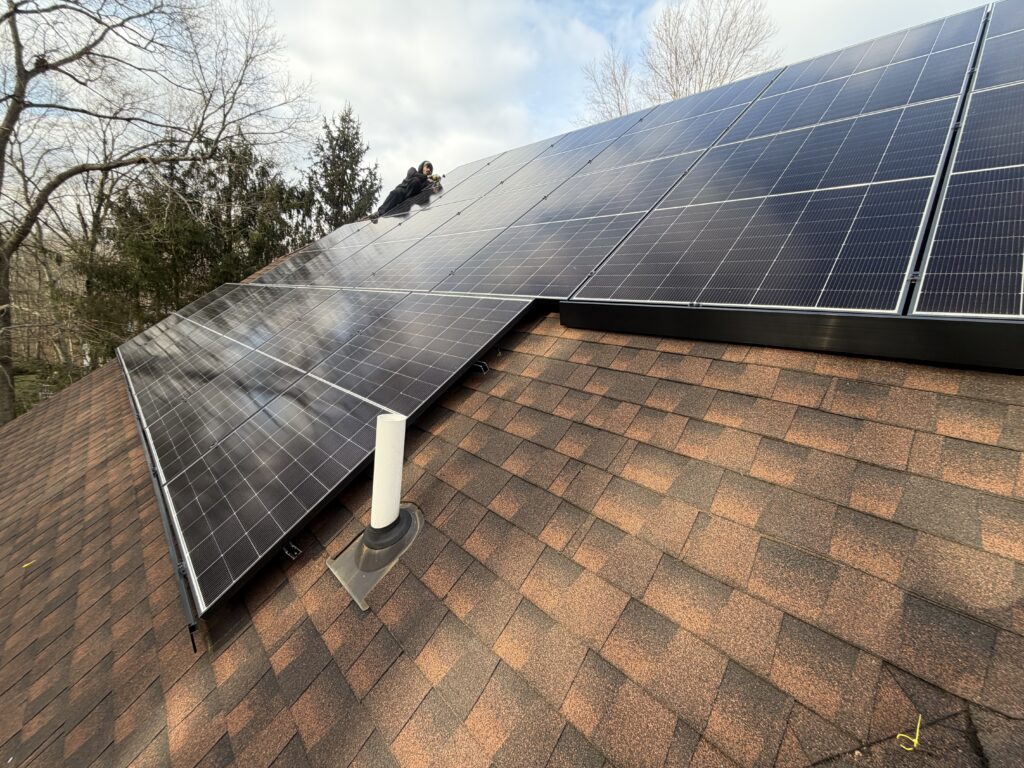
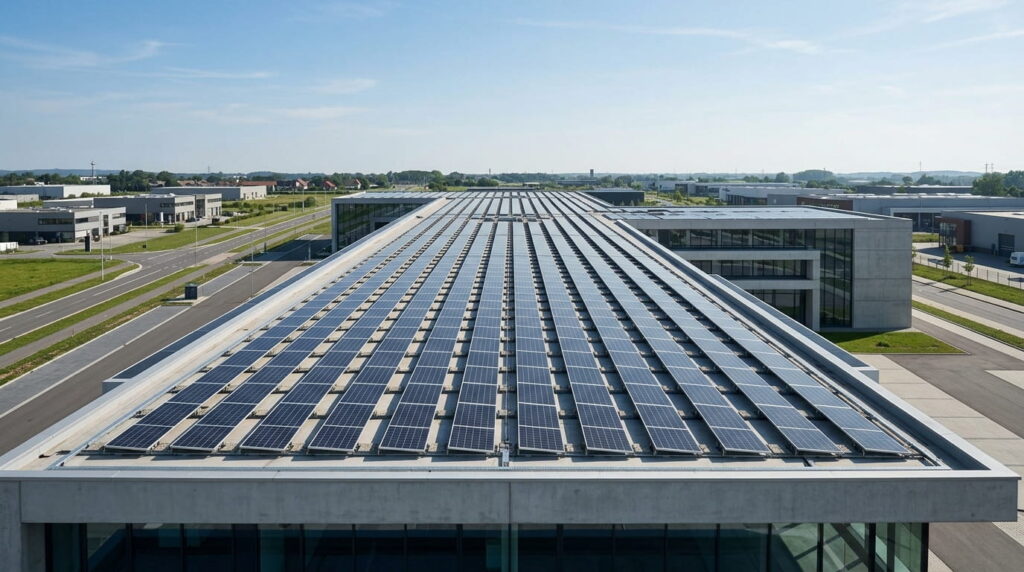
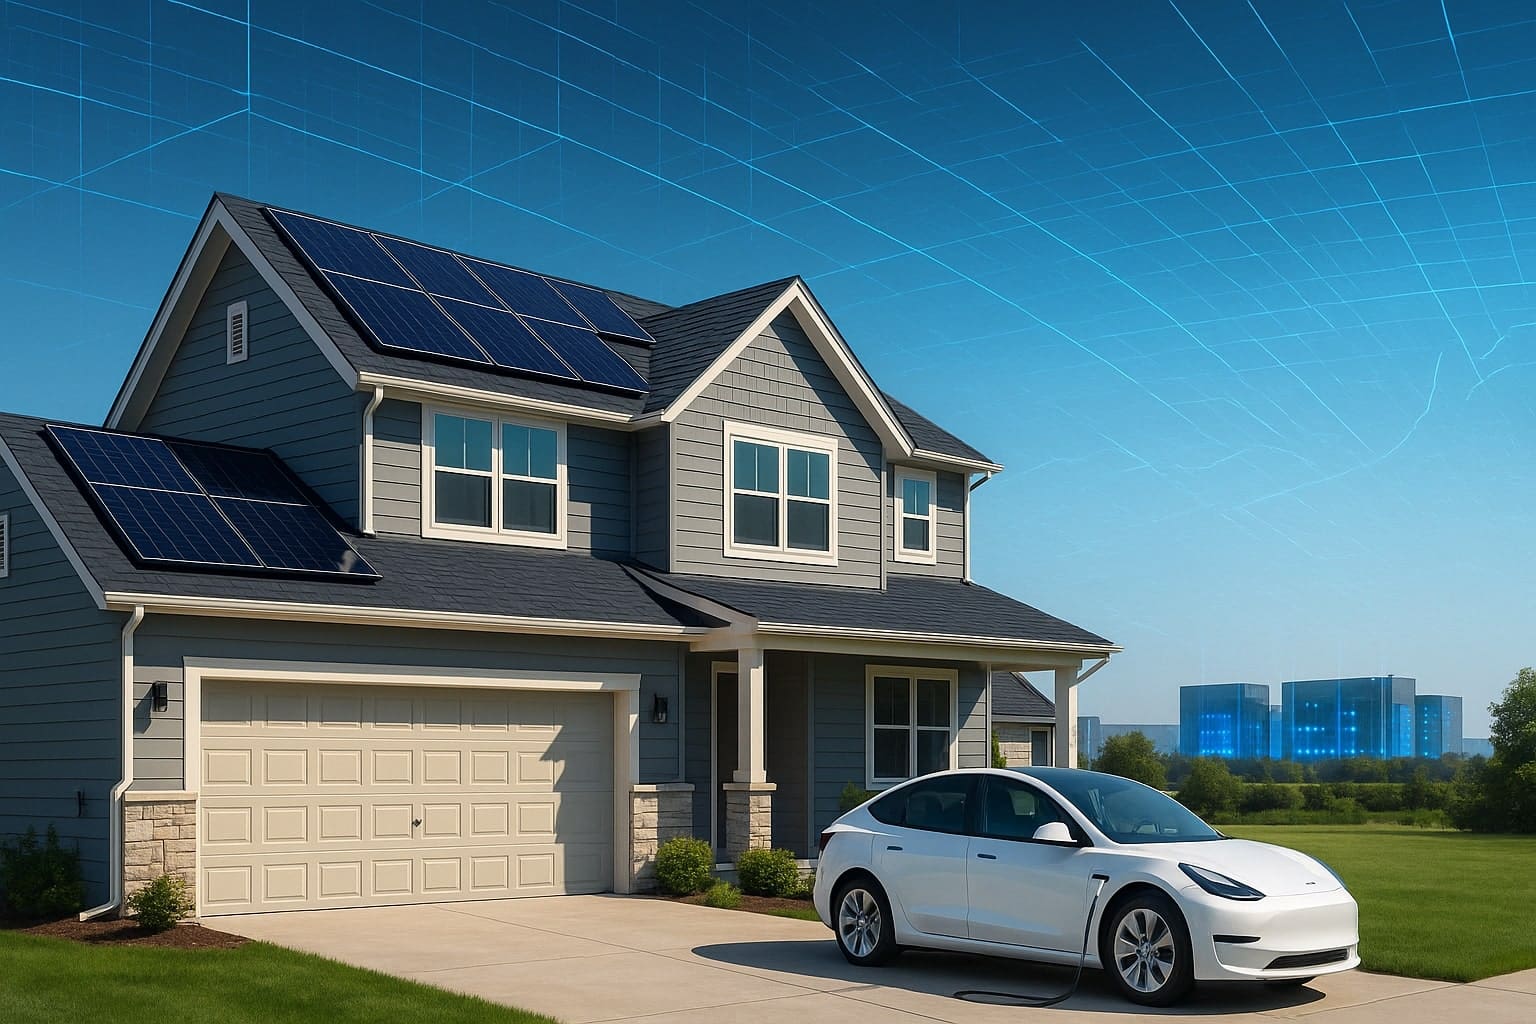
 The residential Solar Market Post Incentive in the United States has undergone a transformative journey over the past decade, fueled largely by federal incentives like the Investment Tax Credit (ITC) and supportive state policies. As of September 2025, the sector is at a pivotal moment. The residential 25D Clean Energy Credit ends for systems placed in service after December 31, 2025, marking the conclusion of a heavily policy-driven phase and pushing the industry toward a value-driven model.
The 30% residential ITC, a cornerstone of solar adoption since 2006, is set to expire for systems placed in service after December 31, 2025, marking the end of a heavily policy-driven phase. This shift compels the industry to pivot toward a value-driven model, where consumer decisions are based on intrinsic economic benefits such as long-term savings, energy independence, and resilience rather than subsidies.
Simultaneously, explosive growth in artificial intelligence (AI) and electric vehicles (EVs) is reshaping electricity demand dynamics. AI-powered data centers and widespread EV adoption are projected to surge U.S. electricity consumption, pushing utility rates higher and straining the grid.
These trends are inadvertently bolstering the case for residential solar, as rising costs make distributed generation more economically compelling. This analysis explores these interconnections, drawing on recent market data and forecasts to assess the residential solar sector’s trajectory through 2030 and beyond.
The Post-Incentive Landscape: A Contraction Followed by Stabilization
The Post-Incentive Landscape: A Contraction Followed by Stabilization The residential solar market experienced robust growth in the early 2020s, with installations peaking at over 5 GW in 2023, driven by the ITC’s 30% rebate and Inflation Reduction Act (IRA) extensions.
However, 2024 marked a 30% contraction due to high interest rates, supply chain disruptions, and anticipation of policy changes. In Q2 2025, residential installations totaled 1,064 MWdc, a 9% year-over-year decline and the lowest quarterly figure in recent years.
The ITC’s abrupt end, without a gradual phase-down for residential systems, has accelerated this downturn. Systems must be fully operational by year-end 2025 to qualify, leading to a rush of installations in late 2025 but a sharp drop-off in 2026. Recent legislation, including HR1, explicitly terminates the 25D credit for rooftop solar and storage at the close of 2025, exacerbating uncertainty.
Industry forecasts from the Solar Energy Industries Association (SEIA) predict a 7% average annual decline in total solar installations from 2025 to 2027, with residential segments hit hardest due to the lack of commercial-style extensions (e.g., the commercial ITC phases out after July 2026).
State-level Policies Offer Some Buffer:
State-level policies offer some buffer: California, New York, and Massachusetts continue net metering and rebates, potentially sustaining 20-30% of pre-2025 volumes in those markets.
However, nationwide, the policy vacuum could reduce installations by 40-50% in 2026, per Wood Mackenzie estimates, as financing costs rise without the ITC’s “bridge” effect on loans. This contraction underscores the market’s historical reliance on incentives, which accounted for up to 50% of project economics in high-subsidy states.
Transition to a Value-Driven Market: Organic Growth Amid Challenges
Transition to a Value-Driven Market: Organic Growth Amid Challenges Post-2025, the residential solar market must demonstrate its standalone value proposition: payback periods of 6-8 years, lifetime savings exceeding $30,000 per household, and protection against volatile energy prices. SEIA’s base-case forecast envisions modest recovery, with residential growth averaging 3% annually from 2025 to 2030, reaching 1.5-2 GW annually by decade’s end, driven by falling module prices (down 20% in 2025) and improved battery integration.
This shift aligns with broader global trends toward market-led renewable adoption. In Europe and Asia, policy reforms have already transitioned solar to a cost-competitive sector, with unsubsidized projects viable below $0.03/kWh in sunny regions. In the U.S., value-driven factors include:
- Technological advancements such as bifacial panels, smart inverters, and improved racking systems are boosting efficiency by 15–20%, shortening ROI even without incentives. For a breakdown of system choices, see our guide on 7 Types of Solar Mounting Structures (And How to Choose the Right One).
- Consumer Awareness: Surveys show 60% of potential adopters cite “energy bill reduction” as the primary motivator, up from 40% in 2020.
- Resilience Premium: Post-hurricane events like those in 2024-2025 have heightened demand for solar-plus-storage as backup power, with 25% of new installs including batteries.
Challenges persist: Higher upfront costs (now $2.50-$3.00/W without ITC) and financing hurdles could sideline low- to middle-income households, limiting adoption to affluent demographics. Yet, as utility rates climb (detailed below), the value proposition strengthens, potentially expanding the addressable market to 50 million U.S. households by 2030.
AI Growth: Surging Data Center Demand and Rate Hikes AI’s proliferation, particularly through hyperscale data centers from companies like Amazon, Google, and Microsoft, is a major driver of U.S. electricity demand. In 2023, data centers consumed 4.4% of national power; by 2028, this could triple to 12-15%, with AI workloads alone accounting for 44% of new demand growth. Projections for 2025 indicate data centers will add 20-30 GW of load, equivalent to powering 20 million homes.
This surge strains transmission infrastructure, necessitating $100-200 billion in grid upgrades by 2030. Utilities are responding with rate increases: In 2025, residential bills rose 5-10% in AI-hotspot states like Virginia, Texas, and Arizona, where data centers cluster. Nationally, the International Energy Agency (IEA) forecasts AI-driven demand contributing over 20% to electricity growth in advanced economies through 2030, pushing average U.S. rates from $0.16/kWh in 2024 to $0.19/kWh by 2028.
Environmental and equity concerns amplify the impact: Data centers’ water and power intensity could compromise grid reliability, leading to more frequent blackouts and further rate hikes to fund fossil-fuel peaker plants as interim solutions. For residential consumers, this translates to annual bill increases of $200-500 by 2030, making solar’s fixed-cost model increasingly attractive.
EV Adoption: Compounding Demand Pressures
EV Adoption: Compounding Demand Pressures EV sales in the U.S. reached 1.2 million in 2024, representing 8% of new vehicles, but growth has moderated to 10% year-over-year in Q1 2025 amid policy shifts like reduced IRA EV credits. BNEF’s 2025 Electric Vehicle Outlook revises down projections, forecasting 15 million EVs on roads by 2030 (down from 20 million previously), yet electricity demand from EVs could quadruple to 780 TWh globally by then, with the U.S. share at 200-250 TWh.
By 2025, EVs are expected to add 50-100 TWh to annual U.S. demand, or 1-2% of total consumption, rising to 9% by 2050. This manifests in peak-load challenges, particularly evenings when charging aligns with household use, prompting utilities to implement time-of-use rates that could increase off-peak costs by 15-20%. The U.S. Energy Information Administration’s (EIA) Annual Energy Outlook 2025 projects EV-related revenues for utilities at $3.3 billion from 2025-2035, but this comes with rate pressures: Average residential rates may rise 3-5% annually in high-EV states like California and Florida.
Synergies with solar are evident: Vehicle-to-home (V2H) tech could offset 20-30% of household demand, but without incentives, bundled solar-EV systems must prove value through savings exceeding $1,000/year per EV owner.
Synergistic Impacts: Rising Rates as a Catalyst for Solar Adoption
Synergistic Impacts: Rising Rates as a Catalyst for Solar Adoption The confluence of AI and EV growth could elevate U.S. electricity demand by 30-50% by 2035, with data centers and transportation electrification each contributing 10-15% of the increase. This duo is forecasted to drive utility rates up 8-12% cumulatively by 2030, per Deloitte and IEA analyses, as investments in grid hardening outpace supply.
For residential solar, this is a double-edged sword. Higher rates erode the payback threshold: A typical 7 kW system now offsets $1,500-2,000 in annual bills at $0.18/kWh, versus $1,200 at pre-2025 rates. SEIA projects that rate hikes could boost organic adoption by 15-20% post-2027, particularly in Sun Belt states where insolation yields 1,500-2,000 kWh/kW annually. Moreover, AI and EV trends favor solar-plus-storage: Data center peaks may coincide with solar lulls, incentivizing utilities to procure distributed resources, while EVs enable “solar fueling stations” at home.
| Factor | Projected Demand Increase | Rate Impact | Solar Market Boost |
| AI Data Centers | 20-30 GW (U.S.) | +5-10% in hotspot states | High: Extends payback to 5-7 years |
| EV Adoption | 200-250 TWh (U.S.) | +3-5% nationally | Medium-High: Enables V2G synergies |
| Combined | 30-50% total growth | +8-12% cumulative | Organic growth +15-20% |
Future Outlook: Opportunities and Hurdles
By 2030, the global solar market is expected to install 655 GW annually, with the U.S. residential segment stabilizing at 2-3 GW/year if value-driven narratives take hold. Innovations like perovskite tandems (efficiency >30%) and AI-optimized inverters could reduce costs 20-30%, per Wood Mackenzie.
However, challenges remain: financing barriers, workforce shortages, and potential tariff disruptions could limit growth. Strategic interventions, like community solar programs, accessible loans, and utility partnerships, will be critical to sustaining momentum.